Cycling Training Zones
While most zone systems across disciplines are similar, FSE uses power zones developed by Hunter Allen and Andrew Coggan. (Sometimes we use heart rate zones by Joe Friel, but not as our primary training metric.) This is a 7 zone model and is specific to power training. Those without a power meter will train using RPE (Rate of Perceived Exertion). This is also a very effective training method.
Classic vs iLevels
Some of you may be familiar with the classic 6 or 7 power zone model that has been popular for years. FSE utilizes an iLevel model from WKO that is nearly the same, but with a few additions. Sweet Spot is added between zones 3 and 4, and FRC is zone 6, above VO2Max and covers most of anaerobic capacity. Below is a zone chart that compares both and also lists the percentages of FTP.
Sometimes we use iLevels to create more precise training targets that are based off a rider’s individual power capabilities. These are custom workouts with specific interval targets and help us push the upper limit of what an athlete is capable of today, in a way that a percentage of FTP based prescription can’t.
All workouts list the primary training zone in the title. For example: Tamarancho Three - VO2/z6 is a Zone 6 or VO2max workout. With warmup and various rest intervals, you’ll ride in most zones, but the primary hard work is done in Zone 6. Go to your Athlete Settings in TrainingPeaks to calculate your zones if you want to see the breakdown. You can also use this Coggan classic zone calculator.

Something to keep in mind…
…these are ranges. There isn’t a physiological switch between these zones. These are all on a continuum between rest and maximal effort; between using mostly fat or mostly carbohydrate as fuel; between 3 different energy systems, the phosphagen, glycolytic, and oxidative; along of scale of lactate production and lactate consumption or accumulation. They can also change 5-10 watts either direction day to day and week to week, depending on fatigue, training phase, nutrition, sleep quality, etc.
As biological creatures, our bodies are always building up or breaking down, based on training, nutrition, and rest. Some days you have it, some days you don’t. We’re really looking for trends over time.
Other Zones Models
There’s a variety of good zone models out there and they just break down the range of intensities in different ways. A common one in cycling and running is the 3 zone, or polarized model. This is useful and is often used in research and scientist speak, so it’s good to understand it.
In a 3 zone model, the crossover into zone 2 is the first aerobic threshold, sometimes referred to as LT1, VT1, or AeT. This inflection point is generally measured by a sharp increase in lactate production. This is roughly zone 2-3 in the Coggan model.
The second transition into zone 3 is about threshold or FTP. Also known as LT2, VT2, or AT, anaerobic threshold. This is zone 4 in the in the Coggan model.
The 3 zone is simpler system, but doesn’t get as specific as we like for training purposes.

3 Zone model popularized by Dr Stephen Seiler.
RPE Training Zones
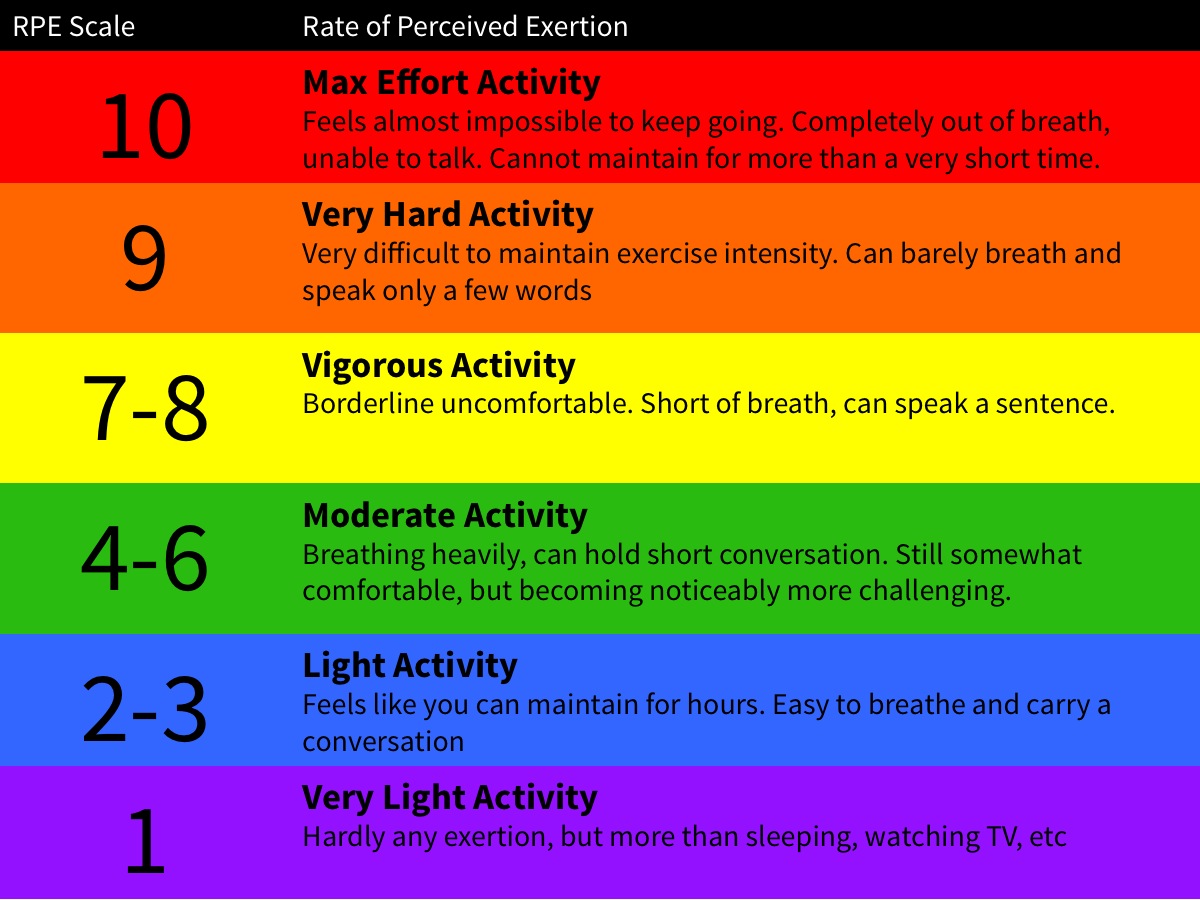
If you don’t train with power, you’ll use RPE, or Rate of Perceived Exertion. This a 1-10 scale with 10 being a maximum sprint. This method of training is very effective and scales to how you’re feeling on a given day. While the number correlates well with maximum effort for a given time, sometimes we don’t want you pushing that hard.
For instance, RPE 5 is Sweet Spot or just under threshold. But for some SS intervals you could ride at threshold or RPE 6. However, that would be too intense and could affect your workout the next day, so keeping it at about RPE 5 is better. It takes practice to get good at using RPE, but once you do, it’s the most effective training method other than power training.
Feel free to download and print the RPE chart below to reference frequently.