Cycling Metrics Glossary
This is a list of the common terms and metrics found in TrainingPeaks and WKO. Some terms, such as FTP, are common across the cycling world, but others are more specific to WKO5.
Functional Threshold Power (FTP)
The highest average power in watts a rider can maintain in a quasi-steady state without fatiguing. Typically considered the average power a rider can maintain for 1 hour, sometimes measured as 95% of 20 minute power. Often referred to as anaerobic threshold, it’s the point at which lactate production exceeds lactate clearance in the muscles, causing metabolic acidosis and fatigue. It’s the primary metric for setting training zones. In the current Coggan 7-zone system we use, zone 4 is threshold.
Modeled Functional Threshold Power (mFTP)
This is an FTP estimate by WKO based on actual performance over the last 90 days. It can be very accurate if you have done a very hard 20min effort within that time frame. Without longer duration steady-state efforts, it will lose accuracy. It also assumes an average deterioration of threshold fitness, regardless of other types of training and individual differences in physiology.
Lactate Threshold Heart Rate (LTHR)
Similar to FTP, but measured as heart rate (bpm). Measured as your highest average 10min bpm during an FTP test, and another way to set training zones. FSE generally trains with power since hard intervals are not as accurately reflected in HR data. HR is also affected by stress, sleep, overtraining, medications, etc. However, we like to have HR data because when it’s correlated with power, we can measure heart rate drift and decoupling.
An estimate of the training load created by a workout based on intensity and duration. 1-hour of cycling at FTP is 100 TSS (111 for running). The intensity side is measured with a power meter in watts. Without power data it will estimate based on heart rate data, if available. However, this is less accurate at measuring intensity compared to power.
For an hour workout, 50-60 TSS is medium intensity, 70-80 TSS is fairly intense, and 100 TSS is maximal, assuming your FTP is accurate.
Training Stress Score (TSS)
Watts per Kilogram (W/kg)
Power in watts one can produce per kilogram of body weight. Generally measured using your FTP, but can also be measured for different time frames for comparison. Considered the only way to make true comparisons of different riders’ fitness, since body weight has the greatest effect on speed, along with aerodynamics.
Typically, a very good amateur racer will be about 4 W/kg. Domestic and World Tour Pros will be 5 and even 6+ W/kg for FTP. While this number is very important for climbing, it is less so for flat roads, when absolute watts matters more for breaking through the wind. Even with larger frontal areas, heavier riders tend to have an advantage in the wind compared to smaller riders because they typically produce more power.
Pmax
The maximal power in watts that can be generated for a very short period of time, such as 5 seconds or less. Important for sprinting and track racing, Pmax has less importance for other types of racing, especially steady-state events such as time-trials.
Most decent amateurs can produce a Pmax of 1000w. Top sprinters and pros can be well above 1500w. Higher bodyweight also plays a role in peak watt capability.
Stamina
A measure of resistance to fatigue during prolonged duration, moderate intensity (i.e., sub-FTP) exercise. Measured as a percent of maximum beyond 1 hour. In other words, it’s a percentage that indicates power drop off after 1 hour of riding. Most individuals fall into the 75% - 85% range. This metric is more important for longer events such as endurance races or rides lasting 3 hours or more. Our goal is a higher percentage, meaning less power drop off after an hour.
Functional Reserve Capacity (FRC)
The total amount of work, measured in kilojoules, that can be done during continuous exercise above FTP before fatigue occurs. FRC acts like a battery - above FTP you are draining that battery, below and you are recharging it.
The higher above FTP you go, the faster the battery will drain. With training, this battery can increase in size, allowing you to go longer, faster, or both. Once this battery is depleted, you are forced to drop below FTP to recharge. Average numbers for FRC are 13.5 - 22.9 kJ. (The aerobic system is what recharges this battery, so a strong aerobic base is critical to putting out many repeated efforts above threshold.)
Time to Exhaustion (TTE)
The maximum duration for which a power equal to FTP can be maintained. TTE is a more precise measurement of how long you can maintain your FTP. While FTP is considered to be your average power output for an hour, this is not always the case and can range from 30-70 minutes. TTE is a more accurate time for FTP.
VO2Max
Also known as maximal oxygen uptake, it is the measurement of the maximum amount of oxygen a person can process during intense exercise. Measured in liters per minute (L/min), it is often used to gauge an endurance athlete’s genetic potential. However, while the maximum number is determined by genetics, few amateur athletes have reached that potential, therefore it can be very trainable.
To compare across athletes of different body sizes, the measurement of milliliters/kilogram/minute (mL/kg/min) is used. VO2Max drops with age, but a typical male is 40 ml/kg/min, and female is 32 ml/kg/min. Elite athletes will be 60+ ml/kg/min for men and 55+ ml/kg/min for women. Top World Tour Pros can be 80-95 ml/kg/min.
The number listed in WKO is an estimate. The only way to measure VO2Max accurately is with a metabolic cart, usually in a lab.
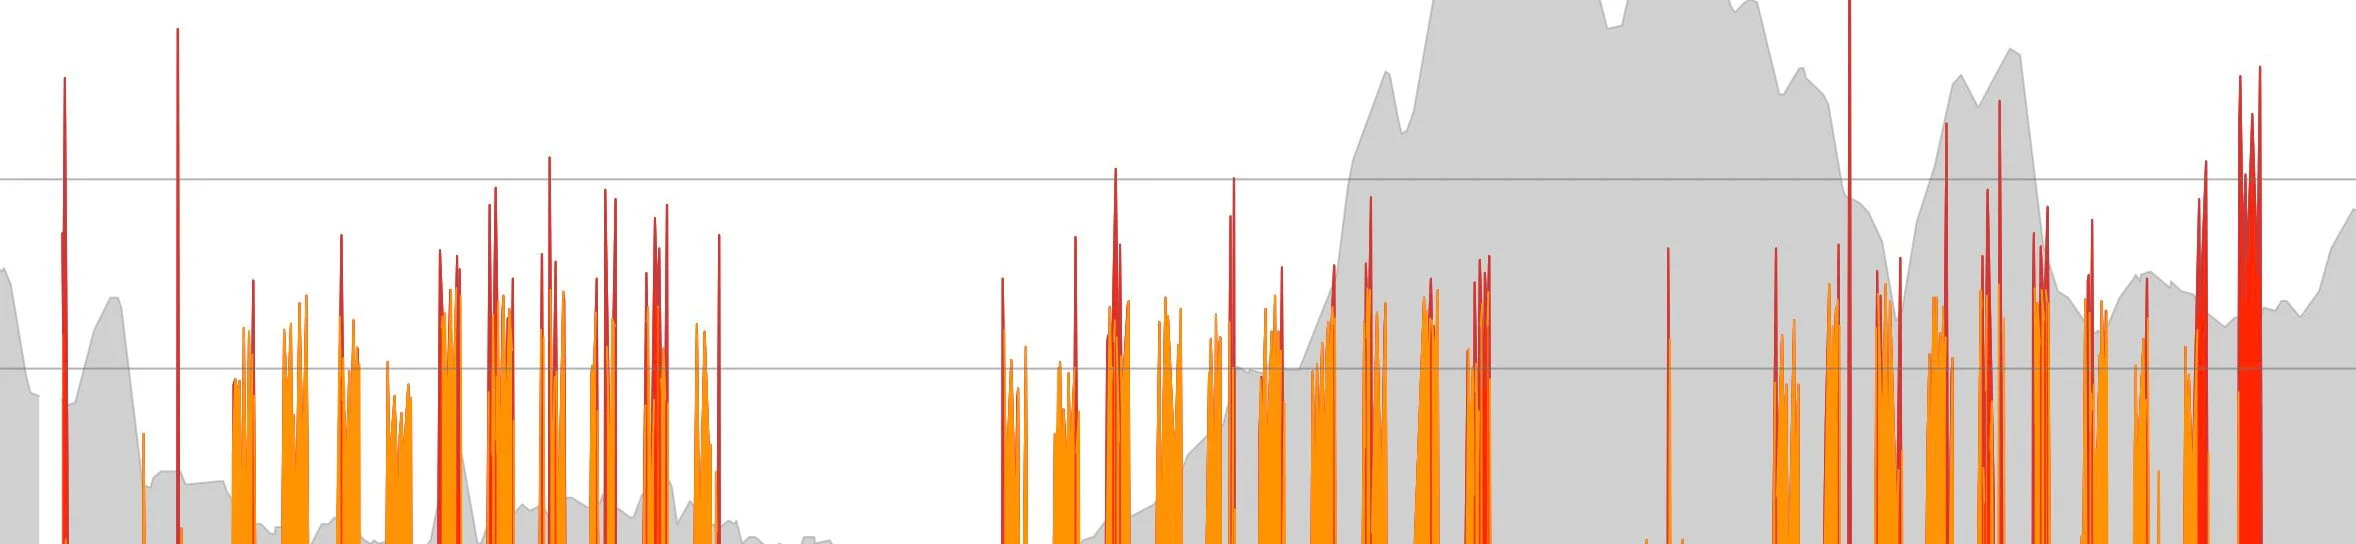
Performance Management Chart
The PMC is a graph that shows your training load over time. Using TSS, it shows 3 metrics, Fitness (CTL), Fatigue (ATL), and Form (TSB).

The PMC showing a full year.
CTL, or Chronic Training Load is an exponentially weighted average of your daily TSS from the last 42 days. A workout you did today has more impact on CTL than a workout you did 42 days ago. A steady increase in CTL indicates a consistent and steady increase in training load. A drop in CTL indicates your training load has dropped.
ATL, or Acute Training Load is an exponentially weighted average of your daily TSS from the last 7 days. Therefore it reacts quicker than CTL, both going up and going down. It’s this differential that allows us to maintain fitness longer, while losing fatigue quicker. This is how we can be both fit and fresh at the same time.
TSB, or Training Stress Balance is yesterday’s CTL minus yesterday’s ATL. TSB is an indication of your form, or how fit and fresh you are to compete. A very negative TSB number indicates you are carrying a lot of fatigue and while you may be fit, you may be too tired to compete well. On the other hand, if your TSB is above 25 or more, you may be very fresh, but you’ve lost fitness and also may not compete well. Everyone’s ideal TSB number is very individual, but we try to keep it within -5 to +20.
An important note: the PMC only shows your training load, not how well you will perform. You may have a high CTL, but that doesn’t indicate what your workouts looked like. Was it all long slow distance, or short hard intervals? These can give you a similar CTL, but will result in very different performances, depending on your race discipline.
Also keep in mind that as biological creatures, our FTP can fluctuate day to day. Since TSS is based on our FTP, all of these metrics can have minor fluctuations as well. Don’t fixate on a few numbers up or down, but on overall trends.
It’s not uncommon for racers’ CTL to go down during race season. Because of intense, but relatively short races (crits, XCO, etc), overall volume for the week can drop. However, racers may be the fastest they’ve been all year, even though their CTL has gone down. While CTL may degrade in a linear, mathematical fashion, athlete fitness does not. For example, hard intervals tend to maintain endurance for longer periods, but not vice versa.
What is a good CTL? This really depends on what your goal events are, but generally speaking, anything above 50 means you have decent fitness. Good amateur racers would be 60-70, top amateurs around 80-90, and pros would be 100+, though World Tour pros racing grand tours can be 150+. Volume is the greatest driver of CTL.
A typical PMC will show natural fluctuations throughout the year. Higher during race season, lower during the offseason, or even the opposite. It really depends one’s schedule, goals, race discipline, and illness or injury.